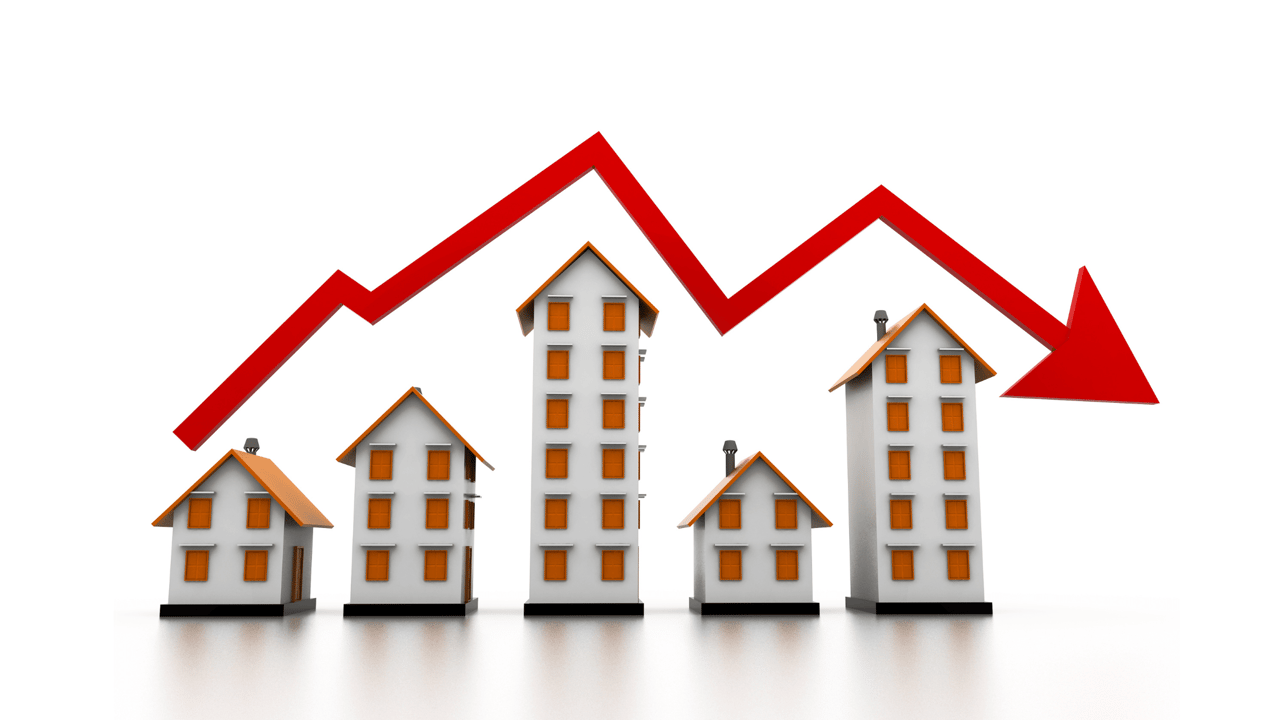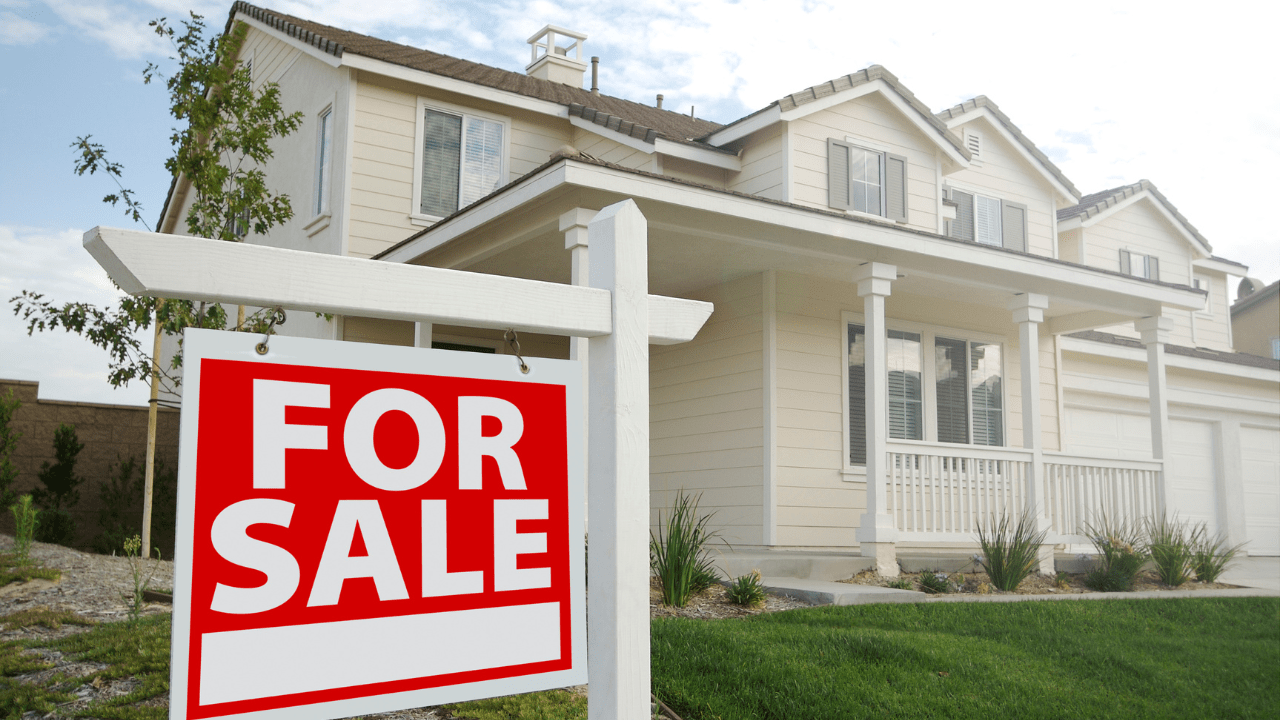
As far as fierce real estate conditions go, this year is one for the record books. Not just locally, but across the country, we hear of extreme levels of buyer competition, homes selling for 10-20% or more above list price, and the volatility of the market after the Marshall Fires have made for a wild ride.
How We Got Here
After starting off with some of the most explosive months on record for price appreciation and buyer demand, as we make our way into the early summer, we are starting to see buyers reign in their extreme offers and sellers are having to be more realistic about what price they are listing at. This has largely been driven by the increase in interest rates and also some by the recent trouble in the stock market. Buyers are faced with taking on higher monthly payments along with having a little less disposable income as their brokerage accounts have taken a hit. If these conditions persist, we will likely have a considerably calmer second half of the year.
Where We're At
Will these conditions persist? There are many individuals in the mortgage industry that believe that we are reaching a peak for the year for interest rates and that we will see lower numbers in the second half of the year. That is because as the Fed raises its interest rates, that usually serves to curb inflation, which then cools off the rise in mortgage interest rates. However, as of this time, the recent moves from the Fed haven't seemed to have as significant an impact on inflation as was hoped. That means there isn't likely to be any immediate relief in mortgage interest rates. It does seem like we will be in a 5%+ interest rate environment for some time.
What Does It Mean
For the real estate market, this very likely leads to much more modest gains in the second half of the year. Even if mortgage rates stay high through out the end of the year, there are still a number of other factors that will continue to drive housing demand that make it very unlikely that we will see any kind of decrease in prices.
We just finished compiling the most recent numbers for Boulder County and the Denver Metro. Read on below for an in-depth analysis of market conditions.
Median Sold Price
The statistic on top of most buyer's and seller's minds is the Median Sold Price. The Median Sold Price statistic shows whether home values in an area are increasing or decreasing as compared to previous years.
Median Sold Price- Boulder County- Single Family

The above chart represents the Median Sales Price in the Single Family Home Market. The gains shown here represent year-over-year gains.
Median Sales Price in Boulder is up 21% year-over-year. Louisville is up 29%, Lafayette is up 21%, and Longmont is up 19%. Lafayette, Superior and Louisville have had unprecedented buyer competition after the Marshall Fire and some of those sales have been unbelievable (some homes were selling for 300K+ above the list price in recent months.)
Of course the areas on everyone's minds after the fires are Superior and Louisville. We've broken these areas out together in the graph below. You can see that the change in Median Sales Price for Superior single family homes is a 24% increase year-over-year and Louisville single family homes selling for 29% year-over-year.

Median Sold Price- Boulder County- Attached Dwellings

Condos and townhomes in Boulder are up 21% year-over-year, Lafayette is up 13%, Louisville is up 19% and Longmont is up 20%.
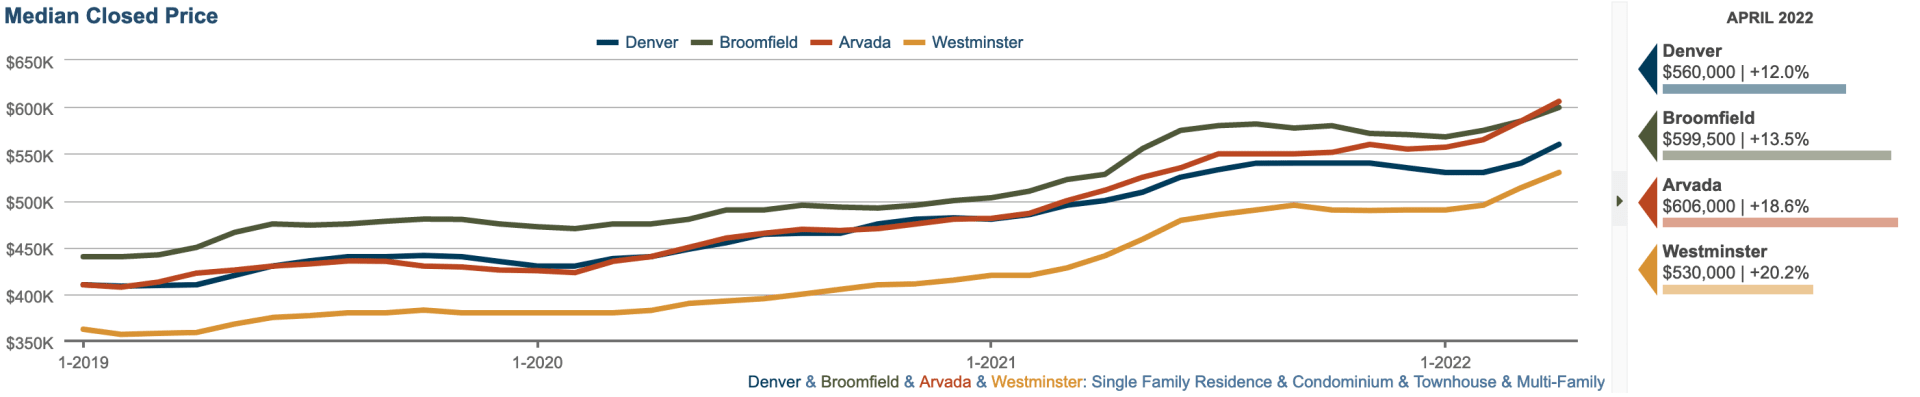
Median Sold Price- Denver, Arvada, Westminster, and Broomfield- Single Family Homes

Denver Metro real estate follows the same trends we have been seeing in Boulder County. Median Sold Price in Denver for single family homes is now at $650,000, up 14% compared to this same time last year. Median Sales Price in Broomfield is up 13%, Arvada is up 18%, and Westminster is up 19%.
Median Sold Price- Denver, Arvada, Westminster and Broomfield- Attached Dwellings
Median sold prices in attached dwellings for the Denver Metro have also seen strong gains, as those who might like to purchase a single family home have been pushed into the attached home market due to high competition for detached homes. Denver attached homes are up 12% year-over-year, Broomfield is up 13%, Arvada is up 18% and Westminster is up 20%.
Months Supply of Inventory
Another metric Realtors use to evaluate market conditions is the “Absorption Rate”. This number is the months of supply of listings currently on the market. It lets us compare how many listings we have to how many buyers are in the market. An Absorption Rate of 6 months means that if no new listings were to come on the market, all current and active listings would be sold within 6 months. An Absorption Rate of below 4-6 months indicates a Seller’s Market.
Months Supply of Inventory- Boulder County

We have moved off the record lows of the first few months of the year. But we are still very firmly in a Seller's Market.
Months Supply of Inventory- Denver, Arvada, Westminster, and Broomfield

The Months Supply of Inventory numbers in the Northwest Denver area are varied. Denver, Broomfield, and Westminster inventory numbers are down as compared to last year. Arvada inventory is up. All inventory numbers remain well below balanced-market levels. As long as inventory remains this low, we should continue to see continued buyer competition for homes and homes selling for above list prices.
Showings per Listing
One interesting piece of data we can consider is the number of showings per listing. This is the median number of showings per listing that are occurring prior to closing. Earlier this year, after the Marshall Fire and as interest rate increases were projected to be coming down the pike, we were experiencing what can reasonably be called "feeding frenzy" levels of activity. Homes were being listed, showing slots filled within hours, and we were seeing dozens upon dozens of showings per listing. The graph below shows showing activity numbers year-over-year. Boulder is seeing more showings per listing now as compared to this time last year. Showings per listing in Lafayette, Louisville, and Longmont are down year-over-year. It might be that we are starting to see the beginning of a slow down as interest rates rise.

Showings per listing is down in the Denver metro area as compared to this time last year as well, although when you look at the figures, homes are still having quite a few showings on average.

Given market conditions, interest rate volatility, and the roller coaster of the stock market, it seems we are in for an interesting second half of the year.
Don't hesitate to reach out if you have questions about the market!
Until next time!
Allison Benham and Ken Crifasi with K&A Properties